Ever heard of the Child Mortality Rate? It’s the number of children, per 1000, who die before the age of 5. This includes Neonatal Mortality and Infant Mortality, but it doesn’t include Fetal Mortality and therefore doesn’t include Perinatal Mortality. Confused? Here’s a refresher (each rate is reported per 1,000):
- Fetal Mortality: Fetal deaths which occur beyond 20 weeks of gestation.
- Some countries report deaths beyond 22 weeks (likely due to continuing confusion between gestational age and menstrual age).
- A second metric (Fetal Mortality 2) includes deaths beyond 28 weeks only.
- Variation exists in local reporting practices around the world. Should a child with Apgar scores of 1 and 0 at 22 weeks be considered a fetal death or neonatal death? It depends on the country and the local customs.
- Terminations are not included in the Fetal Mortality definition. So, a fetus terminated with T13 at 23 weeks wouldn’t count, but if it died in utero and was then delivered, it would count.
- Perinatal Mortality:
- Definition 1: The number of fetal death after 28 weeks (Fetal Mortality 2) plus the number of neonatal deaths in the first week of life (Early Neonatal Mortality). This definition is most useful for monitoring quality of perinatal care because it focuses on the losses where interventions exist which might be helpful.
- Definition 2: The number of all fetal deaths beyond 20 weeks (Fetal Mortality 1) plus the number of total neonatal deaths (both Early and Late Neonatal Mortality). The definition is more commonly used internationally.
- Neonatal Mortality: This should include deaths occurring anytime after birth until 28 days of life (days 0-27).
- Early Neonatal Mortality is any death from 0-7 days.
- Late Neonatal Mortality is any death from 8-27 days.
- Postneonatal Mortality is any death after 28 days until one year.
- Infant Mortality: All deaths occurring in the first year of life (and therefore includes all neonatal and postneonatal deaths but not Fetal Mortality).
- Child Mortality: The proportion of children who die before the age of 5 per 1,000 children in the population.
When you hear about how horrible the United States healthcare system is, it is usually related to our dismal infant mortality rates. Look at this hit piece in the Washington Post, for example, headlined: “Our infant mortality rate is a national embarrassment.” We are told over and over again that we are the worst among the wealthy nations, just 27th in the world, for infant mortality. We even lag behind economically-depressed Slovakia!
So what gives?
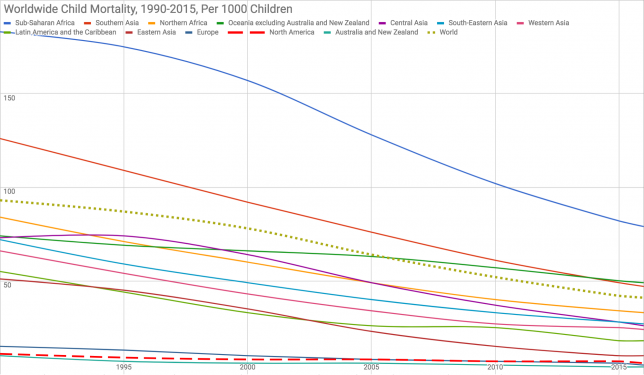
More importantly, how can we have such horrible Infant Mortality but very good Child Mortality? Notice the graph above: the United States has a Child Mortality rate that is bettered only by Australia. Yet, at the same time, we are told that our Infant Mortality rate is double that of most European nations, even though they lag behind the US in Child Mortality. How can this be?
To understand the problem, you have to think a little bit about how each metric can be manipulated.
- To lower Fetal Mortality:
- Encourage termination of anomalous pregnancies. If a pregnancy with trisomy 13 or 18 or Potter’s sequence is born alive, its eventual death will count against Neonatal, Infant, and Child Mortality rates. If it dies in utero, and is then induced, it will count against Fetal Mortality and perhaps Perinatal Mortality. But if it is terminated electively, it counts against none of those. So countries and states with higher rates of abortion and selective termination for anomalies have lower rates of all Fetal, Neonatal, Infant, and Child Mortalities (but not necessarily better total outcomes).
- Induce women earlier. Fetal deaths beyond a given gestational age, say 39 weeks, can all be avoided if those pregnancies are induced at 39 weeks. The problem is that this may just shift mortality from the fetal to the neonatal period. We are currently having this debate in the United States. But countries with lower rates of induction of labor will have slightly higher Fetal Mortality and lower Neonatal Mortality.
- So, lots of terminations and lots of earlier inductions lead to lower Fetal Mortality rates.
- To lower the Neonatal Mortality rate:
- Shift some early neonatal deaths to the fetal period (for example, calling a 22 week delivery of baby with a slow heart rate that dies in a few minutes a fetal demise rather than a neonatal demise).
- Don’t count any delivery before “viability” as a neonatal demise (again, shifting to the fetal period).
- Encourage abortion of anomalous pregnancies that are likely to die in the neonatal period.
- Shift some late neonatal deaths into the post-neonatal period either through false categorization (calling a 28 day demise a 29 day demise, for example) or through technology (maintaining the life of a hopeless neonate with life-support until it makes it into the post-neonatal period).
- To lower Perinatal Mortality:
- Use the more narrow definition of Perinatal Mortality, counting only late fetal and early neonatal deaths.
- Lower the Fetal Mortality rate (with lots of terminations and more inductions).
- Lower the Neonatal Mortality rate with any of the tricks above (more terminations, inappropriate categorization).
- To lower Infant Mortality:
- There are two opportunities to do this: at the very beginning and at the very end of the infant period.
- At the beginning of the infant period, you need lower Neonatal Mortality (by termination of anomalous babies or not counting previable losses as live-born, etc.). This results in a higher fetal-to-neonatal death ratio, which is seen in many countries with low Infant Mortality rates.
- At the end of the infant period, you need to shift 12 month deaths to 13 months either through false categorization or life-support. This will result in a higher child-to-infant mortality ratio as deaths are pushed past one year. This is common in many modernized Asian countries where public health officials are incentivized to have low Infant Mortality.
If you think none of these things happen, you’re wrong. Infant Mortality and Perinatal Mortality have become such important markers of public health and funding and the resources that go along with it that countries around the world play games with these data.
For example, Japan has the lowest Infant Mortality rate in the world. How have they accomplished this? If you look casually, you will see claims of universal access to care and how wonderful and efficient their healthcare system is (though, in reality, it is heavily discriminatory against the poor). But what do they really do? Well, in Japan and Hong Kong, if a child is born alive but dies within the first 24 hours of life, it is considered a stillbirth, not a neonatal loss. This lowers the Neonatal, Infant, and Child Mortality rate, and does so dramatically since such a large fraction of children die in that window of time. Also, abortion is huge in Japan. The birth control pill was only introduced in Japan in 1999 and condoms and abortion have been the main methods of birth control for decades (abortion has been legal since 1949 and completely culturally accepted). This means that most fetuses with suspected anomalies are terminated in Japan (this is not the case in the US), leading again to fewer deaths across all the metrics since a large portion of fetal, neonatal, infant, and child deaths come from congenital anomalies: aneuploidy, heart defects, renal defects, etc.
Most developed countries don’t count very low birth weight babies against their Neonatal or Infant Mortality rates (considering them miscarriages instead). For example, Germany, Austria, and Canada ignore infants born weighing less than 500 grams, but we do not in the US. Mortality in this group of small babies approaches 90%. Switzerland some other European countries don’t count births of babies under 30 cm (or about 12 inches) in the Neonatal Mortality category; these types of inconsistencies, poor data collection, and under-reporting abound all over the world and conspire to make even Russia look like it has better Infant Mortality than the United States. Walker Ray summarizes some of these points in this piece.
What causes of death contribute to our “high” Infant Mortality rate? The leading causes of death for infants in the US are:
- Congenital malformations, deformations and chromosomal abnormalities
- Disorders related to short gestation and low birthweight, not elsewhere classified
- Sudden infant death syndrome
- Newborn affected by maternal complications of pregnancy
- Newborn affected by complications of placenta, cord and membranes
- Accidents (unintentional injuries); Respiratory distress of newborn
- Bacterial sepsis of newborn
- Neonatal hemorrhage
- Necrotizing enterocolitis of newborn.
The leading cause of infant death are congenital anomalies for which the only intervention to lower the Infant Mortality rate is more elective terminations. Most of the other causes (those in bold) are related to extreme prematurity, with the highest mortality in a group of very low birth weight infants that the rest of the world doesn’t even count.
So, how does the US really compare to the rest of the world in terms of Infant Mortality? Are we really worse than Slovakia? No. The truth is, we cannot answer the question precisely because of the differences in reporting and the other games played by countries around the world to give themselves bragging rights. What is clear is that we should not even consider international comparisons until there is consistent reporting based on clear-cut definitions, and reporting that focuses on specific causes of death, so that we don’t get hammered because US women are less likely to terminate a pregnancy than Japanese women, for example.
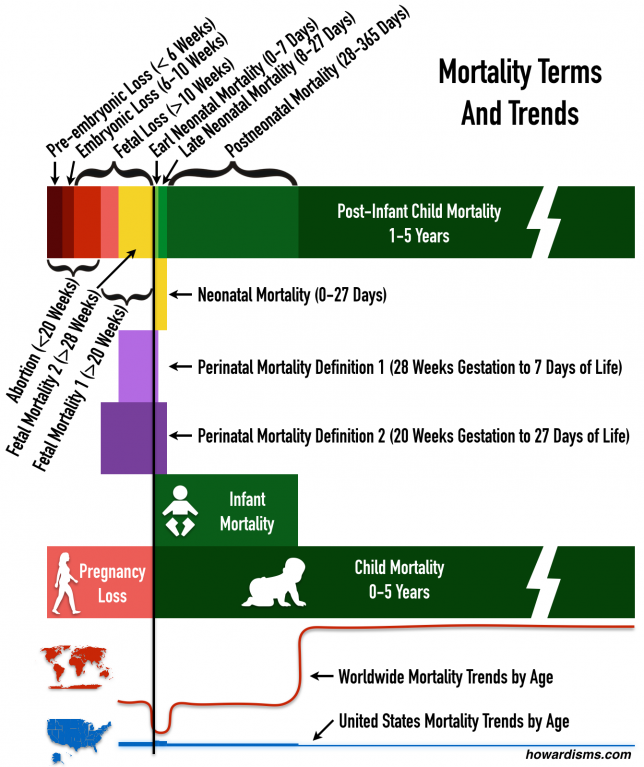
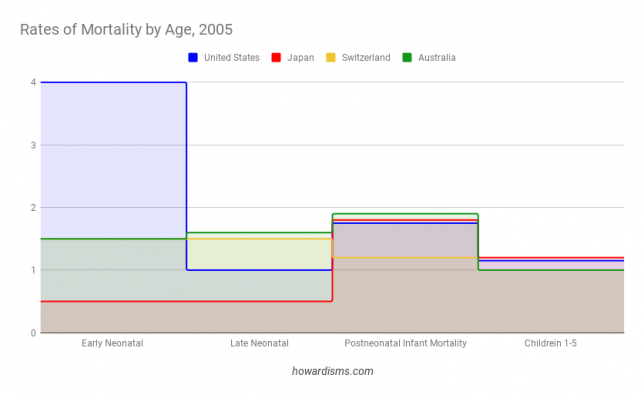
The graphic above shows how confusing the various mortality definitions are as well as the risk of death by gestational/neonatal age in the US compared to rest of the world. Notice that the highest rate of mortality in the US is in the neonatal period and more specifically in the first week of life. For the rest of the world on average, this is the lowest time period of death. How can this be? Because early neonatal deaths are transferred to the fetal period but kept in the neonatal period in the US. This has the effect of making the Neonatal, Infant, and Child Mortality rates all higher.
Notice in the above graph that the United States leads other low Infant Mortality countries in everything except Early Neonatal Mortality. This dramatic difference, all from the first 7 days of life, is the only reason why the US doesn’t lead the world. These regional variation in what counts as a neonatal death versus a miscarriage or fetal death, combined with high rates of elective termination of anomalous pregnancies, is the difference.
Child Mortality is, perhaps, a slightly more honest comparison. Because it accounts for all deaths before age 5, then any attempts to move deaths into different categories won’t affect the numbers. Northern American, as a region, is second only to Australia in most years when this metric is used. Child Mortality is still affected by incorrect counting of neonatal deaths (that is, shifting newborn deaths to fetal deaths). Correction for these reporting differences and controlling for differences in rates of women terminating anomalous fetuses would likely show the US to have the lowest Child Mortality Rate in the world. Even a metric that combined Fetal Mortality with Child Mortality would be problematic due to abortions and low reporting rates of miscarriages and terminations. A pregnancy ended in Japan for a diagnosis of trisomy-13 by cell-free DNA testing at 12 weeks might not have been terminated in the US and therefore would count towards such a combined metric.
One might argue that a good prenatal care system would emphasize detection of anomalous fetuses and early termination. But this is a value statement, not a scientific one. When we compare Infant and Child Mortality to other countries, what we mean to focus on are things like quality of obstetric care and delivery, neonatal resuscitation, penetrance of vaccination, access to emergency care and prevention of accidents, availability of clean water and food, and other public health measures.
International comparisons are unfair at best and dangerous at worst. They are used to inform fallacious policy decisions and typically manipulated for political purposes. Even comparisons among the US states is difficult due to some of the same factors that make international data collection problematic. The data is useful, but only as a sign of progress on state or regional level.
Remember this next time someone criticizes the US infant mortality rate. Later, we should talk about preterm birth rates and maternal mortality rates, because that’s a bit of a mess too.


