

Many great things have been written about the difference between Odds Ratios (OR) and Relative Risks (RR). Every medical student at some point has been taught the difference. Yet these statistical terms are confused and misused every day in both the writing of and the interpretation of literature (which we’ll talk more about at the end if you get bored of the numbers). They are unfortunately assumed to be the same, or basically the same, thing.
Odds are derived from the world of gambling, and are simply an expression of how many times an event is likely to occur compared to how many times the event is not likely to occur. If you roll a dice, there are 6 possible outcomes. The odds of rolling a 3 is 1:5 (or 1 to 5) because there is only one 3 on the dice and there are five other options. This 1:5 could be expressed as 0.2.
The probability of rolling a 3 is 1/6 since there is one 3 among the 6 faces of the dice. This 1/6 is also expressed as 0.166.
So it should be apparent that odds and probability are not the same thing. Odds are not intuitive. When someone asks, “What are the odds?”, they usually mean, “What is the chance?” or the probability. We use probability to talk about chance or risk. We use odds to gamble.
This gets more confusing when we compare odds or risks. We can compare two sets of odds with an Odds Ratio (OR) and we can compare two sets of risks or probabilities with the Relative Risk (RR). Since odds are not intuitive, the odds ratio will also not be intuitive. Risk or probability is more intuitive, and in the same way relative risk seems to be more intuitive. The OR and RR are not the same thing, yet we tend to substitute them for one another, as we will see.
An Odds Ratio (OR) then is simply the comparison of two odds, OR=Odds(A)/Odds(B).
The Relative Risk (RR) is simply the comparison of two risks or probabilities, RR=Probability(A)/Probability(B). This is made more clear when the term is referred to as the Risk Ratio.
Let’s look at this graphically. Below is an experiment where we are attempting to pick a blue card. In situation A, there are five cards, one of which is blue. In situation B, there are also five cards, but now three are blue. The difference in the situations could be anything you like. Think of an intervention like a surgery or a medication that changes the number of blue cards; or think of a risk factor that is different in the two groups. It doesn’t really matter. But there are two situations, A and B, and we are interested in picking the blue card:

So we see that odds makes sense when we say there is a 1 to 4 chance of picking a blue card in A versus a 3 to 2 chance of picking a blue card in B. Odds make less sense when we convert those to 0.25 odds and 1.5 odds.
Probability makes wonderful sense. There is a 20% chance of picking blue in A and a 60% chance of picking blue in B. We can all understand this. And we can relate probability back to odds if we think about it. A 1 to 4 odds means there are five possible outcomes. If you are interested in the blue card, it happens once among those five outcomes, or 20% of the time.
Likewise, relative risk makes a lot of sense. The relative risk of picking a blue card in group A compared to group B is 1/3 or 0.33. We can understand that by looking at the picture. And the relative risk of picking a blue card in group B compared to group A is 3. Put in other words, you are 3 times as likely to pick a blue card in B as you are in A. This makes perfect sense.
But the odds ratio makes no sense (to non-statisticians). The odd ratio of picking blue in A relative to B is 0.16. What!? Exactly. The odds ratio of picking blue in B relative to A is 6. Yet we understand intuitively (and from the RR) that you are only 3 times as likely to pick blue in this situation, not 6 times as likely.
It should be obvious that you cannot substitute ORs for RRs in your thinking. You cannot say with an OR of 6 that you are 6 times as likely to pick a blue card in situation B. Let’s look at picking red, just for fun, and see how the numbers change for the more likely event:
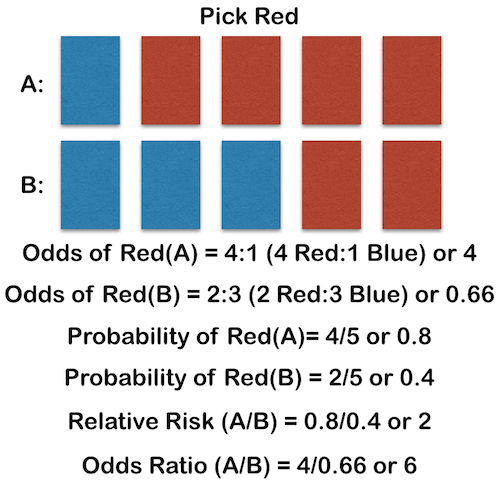
In this case, the numbers are even more exaggerated. We understand that you are twice as likely to pick red in A as in B; and this is borne out in the RR of 2. But the OR is even more misleading since it is 6. In B, you are as half as likely to pick red as in A, or a RR of 0.5, but the OR for this event would be 0.166! So let’s never use OR to imply risk again.
It is true, however, that, in many cases, the OR is approximately (though never exactly) equal to the RR. This is true in rare events. But what does rare mean? Let’s look at another example.
If an event happens in a patient 1/1000 times with an intervention but 2/1000 times without an intervention, then the RR for the intervention group would be:
- RR=(1/1000)/(2/1000)=1/2=0.5
The OR would be:
- OR=(1:999)/(2:998)=0.4995
So in practical terms, these are the same number. How rare is rare? Let’s do the same math for events happening on the scale of hundreds and tens:
For the n per 100s:
- RR=(1/100)/(2/100)=1/2=0.5
- OR=(1:99)/(2:98)=0.495
For the n per 10s:
- RR=(1/10)/(2/10)=1/2=0.5
- OR=(1:9)/(2:8)=0.444
Still not much of a difference, but also not exactly true to use the OR result in the sentence, “You are x times as likely to experience the event if you have the intervention.”
If the OR < 1, it will always be smaller than the RR. Conversely, if the OR > 1, it will always be larger than the RR by some amount. To demonstrate a case where the OR > 1, let’s look at the opposite of that last problem:
- RR=(2/10)/(1/10)=2
- OR=(2:8)/(1:9)=2.25
2 and 2.25 are still very close, but it is clearly not fair to say that something is 2.25 times as likely to happen in this experiment. The more common the problem, or the greater the effect, the more misleading an OR might be. For example, let’s imagine that our study relates to obesity (a common problem). Pretend that if you eat below a certain number of calories per day, you have a 1/15 chance of being obese, but if you eat above a certain amount of calories per day, you have a 1/3 chance of being obese. What do these numbers look like:
- RR=(1/3)/(1/15)=5
- OR=(1:2)/(1:14)=7
So these numbers are different enough to be misleading (you are not 7 times as likely to be obese) but close enough that the average non-statistician (read: doctors, reporters, politicians, patients, other researchers) will assume that 7 times as likely makes sense.
Okay, but does this stuff happen in real life? How often do smart researchers and smart editors make these type of mistakes? Unfortunately, very often (and this is an easy thing not to screw up compared to some very advanced statistics and statistical concepts that are misused in the literature).
In 2001, Holcomb et al studied the misuse of the OR in OB/GYN literature published in Obstetrics and Gynecology and the American Journal of Obstetrics and Gynecology in the years 1998-1999. They studied 107 articles and found the following results:
- 44% of the articles published ORs that were more than 20% different than the appropriate RRs, almost all magnifying the reported effect.
- In 26% of the articles, the ORs was explicitly interpreted by the authors as a RR without justification, meaning that the authors stated, “There is an X-fold increased risk…” Only one study did so and explained to the readers the inherent assumptions they were making by using the OR as a RR.
- In one study on the familial occurrence of dystocia, the authors stated, “The risk is increased by more than 20-fold (odds ratio 24.0, 95% confidence interval 1.5 to 794.5) if one sister had dystocia…” The baseline risk was 11% and the actual RR was 6.75. (Another issue for discussion later is the ridiculously wide confidence interval.)
Articles have been published in almost every field examining the inappropriate use of ORs in the literature, and the conclusions are striking. Grimes and Schulz (in an excellent article) have argued that the use of ORs should be limited to case control studies and logistic regression, where they are necessary mathematically. Unfortunately, the incidence of publication of ORs is increasing and so too are the false conclusions sometimes based on them. More thoughtful reading on the subject can be found here.