
Like dreams, statistics are a form of wish fulfillment. – Jean Baudrillard
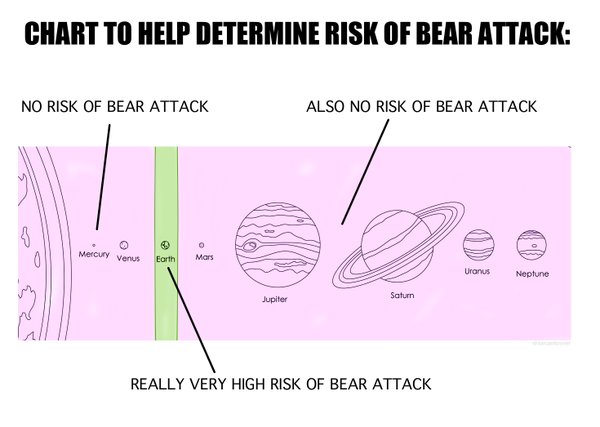
Are you afraid of getting mauled by a bear? I have great news: just move to Mars. That’s right. People who live on Earth are at a really very high risk of bear attacks, but there has NEVER been a report of a bear attack on Mars.
Now there are some downsides and some costs associated with living on Mars, but let me minimize those by not talking about them and scare the living daylights out of you about bears. In the 2010s alone, just in the United States, six people so far have been killed by wild black bears (one even in New Jersey!). This horrifying figure doesn’t include captive black bears, let alone brown bears and polar bears. There is clearly an epidemic of bear violence. Oh, and did you see The Revenant, with the graphic bear attack on Leo? I’m going to Mars. There hasn’t been one bear attack on humans in Martian history, let alone a death.
Not convinced? Well, why do you discount my evidence? I’ll give you nine reasons to do so.
#1. Statistics are what you make of them.
If politics and political reporting have taught us anything at all, it’s that statistics are completely dependent upon context. For example, in December of 2016, the US unemployment rate fell to 4.6%, a low not seen since August of 2007, and down considerably since a recent high of 10.0% in October of 2009, near the beginning of Obama’s presidency. Obama is the greatest jobs president in history! If your bias predisposes you to present the job market favorably, this is how to present the data.
However, if you are affected to present the data differently, then you’ll point out a different set of facts.
The US Labor Force Participation rate fell to 62.7% in December of 2016. This means that a record number of US working-age, able-bodied adults, well over 95 million, are not even looking for jobs in the current low-wage, poor job-conditions economy. The labor participation rate has dropped every year since Obama became president:

And this low work rate has not been seen since the Carter administration, in February of 1978 (it was then in the midst of a decades long rise related to full-female participation in the workforce):

This low work rate is in the face of a record number of Americans living in poverty (42.8 million) and a record number of Americans receiving food stamps (43 million). The jobs Obama did create couldn’t even keep pace with the US population.
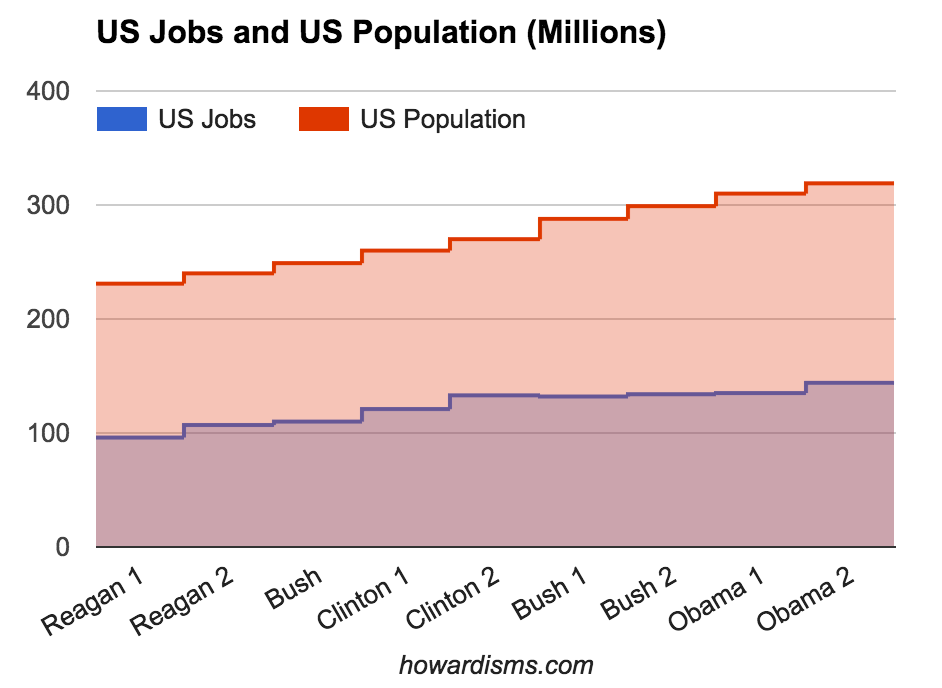
Obama is the worst jobs president in history!
Now I told no lies in any of the above data. The same statistics can and often do lead to exact opposite conclusions. But, I selectively chose which statistics to report and discuss. You didn’t care that I did this as long as you were reading the paragraph you wanted to believe. But it bothered you when you read the other paragraph. Which conclusion is “true”? I would say that I’ll let you decide, but you already decided before you even read the data. In politics, the selective presentation of data and its context is called spin.
#2: Selective reporting of data can be used to support almost any belief.
In December of 1891, Carroll Wright, the United States Commissioner of Labor, wrote,
It is almost a daily occurrence that clear, accurate, and most carefully-compiled statistics are used to prove opposite conclusions. This is done by a jugglery of figures, and it is not the fault of the figures themselves.
Clearly nothing has changed. This political example is better than a medical one, because every one is biased about the issue and therefore will have a predictable and visceral reaction. It is not enough when looking at data to say that you will do so in an unbiased way or that you will just let the data speak for itself and accept its conclusions. This is impossible; none of us can operate without bias. Humans so hate being wrong about what they believe that they will stop at almost nothing to twist, rationalize, or ignore whatever information exists to be consistent with their prior beliefs. Our brains are wonderful at avoiding cognitive dissonance even if it means fudging or ignoring the facts. What’s more, we don’t consciously know that we do this (in most cases) so we cannot consciously change the behavior. (We must use systematic methods to identify and remove bias from data interpretation).
In an editorial appearing in the Chicago Medical Times in 1887, Finley Ellingwood, MD, made these comments while discussing theories of the biological mechanism of sex selection in embryos,
Papers have appeared in a large number of our exchanges during the past year on the determination of sex. The question is largely a theoretical one. Statistics have been used to prove every position taken, and the same statistics have been used to prove opposite positions.
Again, nothing has changed in science either. The search satisfying bias happens every day when people search PubMed and selectively find the one article or piece of data that appears to support their beliefs. Data must be presented in the appropriate context and it must be presented in its entirety. This gives rise to two more important lessons that should always be kept in mind:
#3: Correlation rarely equals causation (and a lack of correlation doesn’t eliminate causation).
Let’s say that you can show whether more jobs or less jobs correlates with the Obama presidency. Does that mean that Obama is the cause? Not at all. Correlation rarely equals causation. Correlation may just be pure coincidence or perhaps both events are caused by another event. US unemployment rates in recent years have been strongly correlated with international unemployment rates. Does the US President affect world employment rates? Or perhaps the same international economic factors affect employment rates around the world? Perhaps those same factors affect voters’ choice for president?
Here are some fun examples. Did you know that the US Highway Fatality Rate is strongly correlated to the number of lemons imported from Mexico?
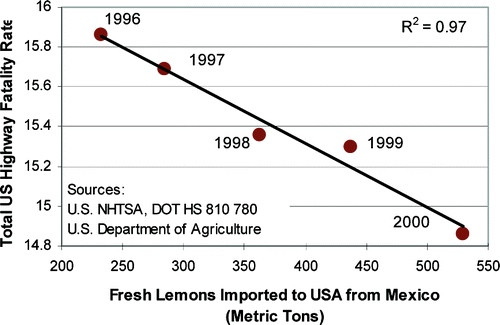
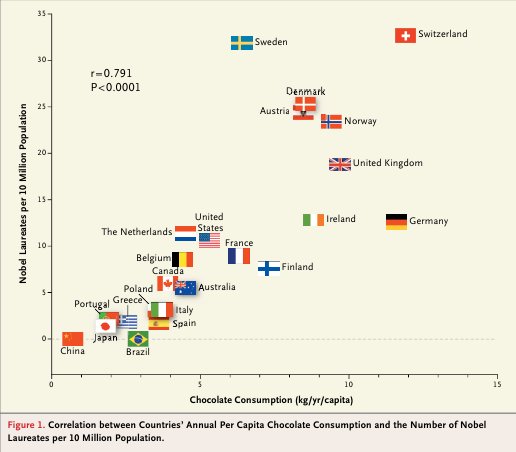
Clearly, we should be spending more money on lemon importation rather than enforcing traffic laws. While we are at it, we should get rid of most fire departments, because there is also a strong correlation between the number of firemen sent to a fire and the amount of damage done to the fire. Also, we need to ban the sale of ice cream on city streets, since the amount of ice cream sold corresponds with the number of serious crimes committed in New York City (shark attacks and drownings are also strongly correlated to ice cream sales). Oh, and grab some chocolate for this one, because the more chocolate you eat, the more likely you are to win a Nobel Prize:
Most people are good at understanding that correlation doesn’t equal causation, but they aren’t good at actually believing it. While everyone has a good chuckle at the above examples, the same folks take seriously studies that show a correlation between the amount of diet soda consumed and weight gain or other such nonsense. American and English people eat a lot of fatty foods and drink a lot of alcohol and have high rates of cardiovascular disease. The French eat a lot of fatty foods and have lower rates of CV disease and Italians drink a lot of alcohol and have lower rates of CV disease. Which of these correlations do you choose to build a health philosophy around? I could go on, but suffice it to say that correlation doesn’t equal causation. In fact, no matter how strong the correlation, there is still no implication of causation. A large amount of evidence published in medical journals is correlative; these studies should do nothing more than encourage someone to design a controlled trial to test causality – but instead, these mostly spurious correlations are adopted into practice. If you enjoy spurious correlations, this website has 30,000 of them.
What’s more, a lack of correlation doesn’t eliminate causation. Correlation simply measures the linear association between two variables, and it doesn’t relate to causation. But remember that two variables may be nonlinearly dependent even though they appear to be uncorrelated using normal tests for correlation.
#4: More than one hypothesis is always satisfied by the data.
Measuring the correlation between two variables is all that we really do in science, and even when we find a strong correlation and make an assumption of causation (probably because we have evaluated the association prospectively and repeated the experiment several times with controls), we still must remember that more than one hypothesis is always satisfied by the data.
Ignorance of this idea is the root of most bad science. Virtually any set of data or any observation can be explained by countless different hypotheses. If you have already decided that your hypothesis is right, and then you find data (any data) that supports it, it is nearly impossible for you to decide that your hypothesis is invalid. Imagine that you come home and see the front door of your home busted open; the burglar alarm is going off and a man wearing a hoodie runs out the back door carrying your jewelry box. You follow the man and discover that he is your neighbor and in his house are your jewelry box and several other valuables. The observed data is all consistent with the hypothesis that he broke into your home and stole your possessions. But are there any other hypotheses that match the observed data? He claims that he heard your alarm go off and went over to investigate since he knew you were not home; when he discovered the front door open, he carried several of your valuables over for safe-keeping until you got home in case the burglar or others might loot your property. This is another hypothesis that fits the observed data. You’ll need additional information to determine which one is most likely.
If you were to design an experiment to test the two hypotheses, you would find a strong correlation for both; that is, you would see a P-value of less than 0.05 for both hypotheses. Remember, the Frequentist statistical techniques we use simply test the probability that the data agrees with the hypothesis given that the hypothesis is true; it doesn’t predict the probability that the hypothesis is true. In this situation, there would be a finding of statistical significance for the hypothesis that the neighbor is the burglar and for the hypothesis that he is not. Remember this next time you read a paper with a statistically significant finding. Ask yourself what other hypotheses might fit the data as well, keeping in mind that an exact opposite hypothesis might also give rise to the same observations.
Recall that a Type 1 Error is the incorrect rejection of a true null hypothesis (in favor of some other hypothesis) while a Type 2 Error is incorrectly retaining a false null hypothesis (and therefore falsely rejecting some other hypothesis). In both cases, the hypothesis being considered is the null hypothesis, not a particular alternative hypothesis. If I do a study to test the effect of magnesium sulfate on the rates of cerebral palsy among neonatal survivors of preterm deliveries, the null hypothesis would be that it has no effect. If I find a statistically significant difference in cerebral palsy among survivors between the two arms of my study, there are three possibilities: a Type 1 Error (falsely rejecting the null hypothesis); my alternate hypothesis is true (magnesium sulfate decreases rates of cerebral palsy); or some other unconsidered hypothesis explains the results (maybe magnesium sulfate increases morbidity among babies most vulnerable to cerebral palsy, resulting in less survivors with the disease).
#5: Don’t accept the alternative hypothesis just because you reject the null hypothesis.
It is this last, third possibility that is too frequently overlooked. Always consider what other alternative hypothesis might explain the data.
#6. Always consider the magnitude of effect.
There are a lot of things that are true that just don’t matter. A LOT. Even if a statistical correlation is valid, and even if we are confident that our theory of causation is true, this doesn’t mean that this “truth” requires action. It is inarguably true that when bears attack humans, there is a great chance of death. It is also true that moving to Mars would eliminate this risk entirely. But of course the idea that we should move to Mars to avoid bears is ludicrous.
But why? Part of the answer is related to the magnitude of effect. The number of lives saved by this ridiculous scheme is inconsequential when put into the context of cost and unintended consequences (which we will get to in a second). In most experiments, when such a small magnitude of effect is observed, chances are it is due to chance. But I used the bear example to remove that possibility; I am admitting that it’s true that moving to Mars will prevent bear mauling. Even though this is true, you don’t care and neither do I.

We need perspective to appreciate the magnitude of effect. As I have mentioned before, we need to think about, talk about, and relate risks and benefits to ourselves, our colleagues, and our patients, in understandable terms.
Consider this: bear attacks are scary; they are what I call boogeymen. Boogeymen have significant emotional and visceral effects, and this tends to bias our perspective. There are about two bear-related injuries per year in the US; but about 15 people are killed every year by dogs and more than 90 by lightning. Bears are definitely more dangerous than dogs, but of course dogs are much more prevalent (and trusted). Remember, you are more likely to die drowning in a kiddie pool in the US than you are to be killed by an assault rifle. But the assault rifle is the boogeyman, not the kiddie pool. We focus too much sometimes on rare boogeymen and too little on every day things that we can do better. This gives us another valuable lesson.
#7: Focus on doing common things well before you worry about unusual things if you want to have the biggest impact.
The Coronis Trial looked at the long term (three year) consequences of different Cesarean delivery techniques and generally found no differences dependent upon the techniques used (this is not to say that there aren’t short term differences). As an example, they found that the rate of hernia (about 0.2% over ten years) appeared no different among women who had sharp versus blunt dissection of the fascia. This type of study is valuable and adds to our current knowledge. I can imagine that if the study had found that one method had reduced the risk of hernia from 0.2% to 0.15%, there would be quite a few people being very dogmatic that their method of fascial entry was superior and should always be used, even though the number needed to treat is 2000. The high number needed to treat should be evidence of the low impact of the intervention and a significant likelihood of a false positive finding. But if you are really interested in lowering the rates of abdominal hernias, do less cesarean deliveries! Most obstetricians could cut their cesarean delivery rate in half if they followed current labor management guidelines; doing so would have the biggest possible impact on their patients’ outcomes. Until they do these common things correctly, they really have no right to consider less common practices.
A real example of this type of boogeyman is one layer versus two layer closure of the uterus to prevent future uterine rupture. The Coronis Trial found 1 rupture among 1610 subsequent pregnancies in the one layer group and 2 ruptures among 1624 subsequent pregnancies in the two layer group. This data is not statistically significant, but let’s imagine that it was: the number needed to treat (NNT) to prevent one uterine rupture by doing only one layer uterine closures would be at least 1638 and likely much higher with a larger sample size, so we can round to 2000. This unreasonably high number is enough to demonstrate that the data is not significant, either statistically or clinically, yet you and I both know providers who refuse to do trials of labor in women who have had prior one layer closures, even though my example from the Coronis trial showed more rupture in the two layer group. Funny how people misunderstand statistics.
If a boogeyman is a rare thing that gets too much attention and concern because it invokes a negative visceral response (bears, sharks, assault rifles, etc.), what about a rare thing that gets too little concern because it seems innocuous? I call these the Veratri.

Veratrum is a genus of a beautiful white flower. Eat one, though, and you’ll probably die of a heart attack. Veratri are the opposite of boogeymen: they seem harmless at first glance and are often underestimated. There is no programmed, negative visceral response to white flowers. One example of a veratri is the use of antibiotics for 3rd and 4th degree vaginal lacerations. Currently, the American College of Obstetricians and Gynecologists recommends a single dose of a second generation cephalosporin at the time of repair for any obstetric injury involving the anal sphincter. This is a relatively new recommendation (after hundreds of years of not doing so) based upon a recent randomized, placebo-controlled trial which showed that only 8% of women who received the antibiotic developed serious wound complications at two weeks compared to 24% of women who received placebo. In other words, the number needed to treat (NNT) is only 6.3 patients to prevent one serious wound complication.
This low NNT (6.3) shows the statistical significance of the data and also the clinical significance of giving the antibiotic. Yet many obstetricians discount this recommendation because they rarely see the condition (I have never seen a wound complication from an obstetric anal sphincter injury, but then I’ve only had 10-15 in my entire career) and because it is contradictory to decades of practice. If the opposite circumstances had existed where the former practice had been to give antibiotics but a new study showed that it was not valuable, then these same obstetricians would fight just as hard to keep giving them. I call this cognitive inertia. It’s just much easier to keep doing the same thing and justifying your current beliefs than to believe that you’ve been wrong about something most of your life. Cognitive inertia explains, for example, why obstetricians continue to give magnesium sulfate for tocolysis despite all available scientific evidence saying that it is ineffective for this indication.
Both boogeymen and veratri are metaphors for the cognitive bias called base rate neglect.
But back to the bears. Let’s say that you’ve looked at all the data about bears and their heinous attacks on humans and you believe that the magnitude of effect of moving to Mars is justifiable given this epidemic; you still must consider the unintended consequences of moving to Mars.
#8. Unintended consequences are just as important as intended consequences.
A lot of true things with meaningful effects still shouldn’t be done due to the unintended consequences of the action. A good study will pick outcomes that matter, as I have previously discussed. For example, the point of giving a tocolytic is to make healthier babies, so outcomes should focus almost exclusively on neonatal outcomes, not frequency of contractions or time to delivery. Likewise, cancer screenings like mammography or colonoscopy should focus on total mortality and total morbidity, not sub-outcomes like death from breast cancer or colon cancer. Or interventions like prophylactic oophorectomy or salpingectomy should not focus just on death from ovarian cancer, but total mortality and morbidity as well as quality of life years.
But clinical outcomes aren’t the only unintended consequences to focus on. We also must consider cost. This seems unethical to many people who feel uncomfortable even considering withholding an intervention from a person or group of people due to cost; but the truth is, doing so is actually one of the most ethical things a physician can do.
Consider for example example doing a full-body CT scans every 3 months on every person in order to detect cancers and other serious pathologies very early (I can hear the mouths of Radiologists across the country watering). A first year med student can see that the unintended consequences of this are prohibitive. The radiation exposure, for example, would likely lead to more cancers over time than are prevented. What if we use MRI instead to remove this unintended consequence? Next the savvy student will think of over-diagnosis and over-treatment of incidentalomas. This is an excellent point as well. But fewer students will think of the ethical principle of Justice.
Doing these MRIs would cost at least $4 trillion per year just for the imaging, let alone for all the costs from incidentalomas, etc. That’s more than the entire cost of our current healthcare system. The ethical principle of Justice requires us to spend our money and resources in the most ethical way; in essence, we must get the most bang for our buck. That means that we can and should place a value on human life and on quality of life years. This cost analysis, in turn, must be considered when any new drug or intervention comes along for our assessment. Think of it this way: when you order an unnecessary (or low yield) test on a patient, you might be denying a life-saving vaccine to a child. This leads us to the last lesson, a modification of a previous lesson:
#9: Focus money and resources on high-impact tests and interventions before you spend resources on low-yield therapies and diagnostics.
We cannot practice medicine in a responsible way without understanding how to utilize data in the correct way. Unfortunately, most medical providers continue to pervert data for their own devices and many fall back on anecdotal medicine because it is more comfortable for them.
Cognitive psychology tells us that the unaided human mind is vulnerable to many fallacies and illusions because of its reliance on its memory for vivid anecdotes rather than systematic statistics. – Steven Pinker
The keyword is unaided. There is a right way to do evidence based medicine, but most people who claim to believe in EBM are not doing it well. They have data dreams but not a systematic approach to data analysis. For all its faults, evidence based medicine is still leaps and bounds ahead of anecdotal medicine.
I’ll provide one simple piece of evidence for this assertion. A new study, just published, sought to build upon previous knowledge that female physicians are more likely than their male counterparts to follow clinical guidelines and evidence based practice. They gathered data to see if this rational female adherence to data had an impact on patient outcomes compared to the irrational male adherence to anecdotes and their own perceived omnipotence. Guess what? Patients treated by female physicians had lower 30-day mortality and lower 30-day readmissions than patients cared for by male physicians. Sorry guys.
For a more formal consideration of these principles, please read How Do I Know If A Study is Valid?